Lake Data & Maps
Since at least 1979 volunteer citizen scientists and VT DEC staff scientists have been collecting data on the inland lakes, including Lake Iroquois, in Vermont. The historical data show a trend toward higher nutrient levels in Lake Iroquois. However, with the many projects undertaken by the LIA since its founding in 2007, that trend has begun to change. The Lake Scorecard shows that Phosphorus levels in Lake Iroquois are showing a significant decrease. This is an important indicator as higher nutrient levels along with the warming climate can cause toxic cyanobacteria (blue-green algae) blooms. Nutrient levels will never be zero as nutrients enter the lake from natural phenomena such as vegetation moving and some nutrients are necessary to support native aquatic plant species. The LIA continues to work toward preventing as much human caused sediment and nutrients from entering the lake as possible.
Data
- Lake Iroquois Scorecard
- Lake Water Quality Detailed Dataset (Select Iroquois from drop down menu on the left)
- Lay Monitoring Data
- Spring Phosphorus Data
- Vermont Integrated Watershed Information System
Maps
Map of Lake Iroquois Wake Sports Zone
")
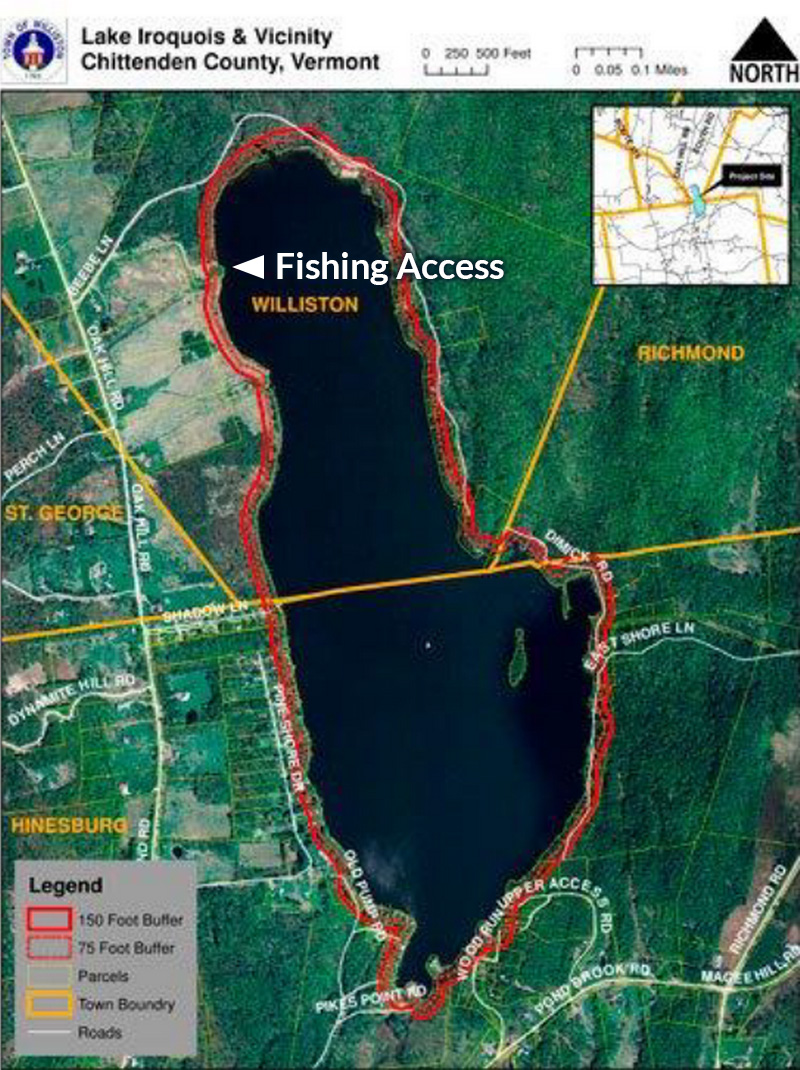
Map of Lake Iroquois
Map showing boat ramp and town boundaries.
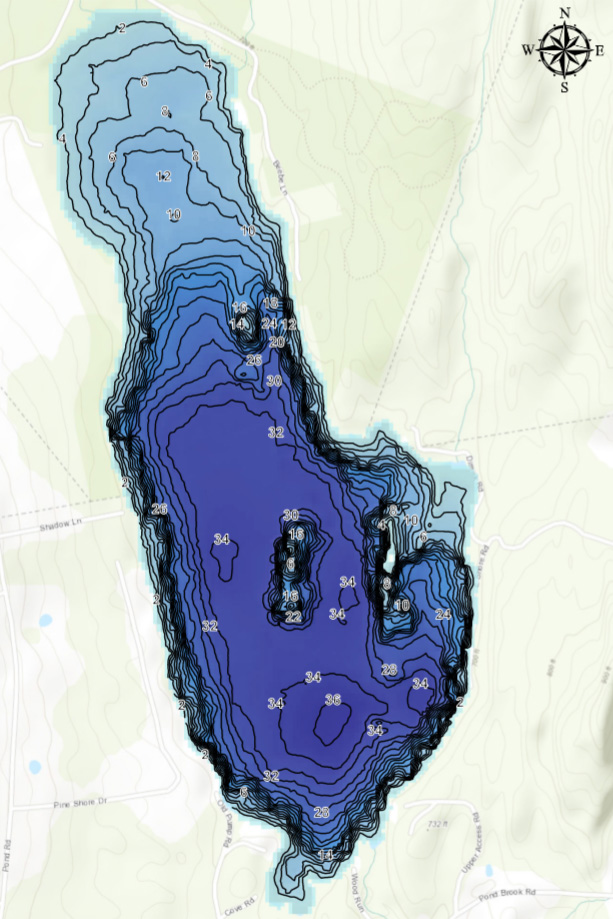
Bathymetric Chart
Chart showing water depths. Download a PDF version.

VT State Aquatic Invasive Species Map
View the status of invasive species across Vermont in this interactive Google Map.